Service Desk Dashboard
This project was initiated out of the desire to improve an existing Service Desk Dashboard access and visibility. The dashboard used to be an Excel file hosted on the network on a remote server.
Where it all started
The dashboard was accessed as an Excel file over the network. This caused latencies at the remote sites. The Excel file also took time to load once started and the half hourly feed refreshes took time to load. And sometimes data had to be loaded manually. There was also the need for the user to be logged in the local network to have access to the file. I felt a new dashboard was needed that could be easily accessed and displayed for different mediums and formats. Following is how I proceeded.
Research phase
Were is the data?
To get an idea on what to expect I needed to do a little bit of research. First I needed to understand how the Excel report was working. Luckily the Excel report had an excellent documentation, which helped a lot to understand how the Metrics were calculated out of the raw data provided by SQL servers. However, the main data the Excel file was feeding of were CSV files.
How to read the data?
Knowing the metric data was stored as CSV files meant that I had to parse the files into JSON format, so I can use the data with Javascript. After further research, I decided to use Papaparse as a CSV to JSON parser.
Which framework to use?
At this point I was not 100% sure on which frameworks to use on the client side. I thought about using JQuery and Bootstrap if this could get the job done quickly. I knew that I needed to add authentication, authorization and other functionalities as I was developing the dashboard for an enterprise environment. I also wanted an easy way to bind the data I intended to feed to the application. I ended up choosing Angular, as the framework was all encompassing and I did not need to add additional libraries to manage state, bind the data and share data between components.
For styling I ended up choosing Bootstrap. I used it before, so I was familiar with it. It was the easiest option for me to get the web-app to be responsive.
Implementation
The first step was to get PapaParse to parse the CSV files into JSON format. I had two of files that I needed to parse. One containing the monthly metrics, one the hourly metrics.
While trying to implement the parsing, I realized that the results are to be processed asynchronously. To test the file parsing, I used functions callbacks. But later on I used RxJS Observables to wrap the Papaparse callbacks. More on this later.
Both files had raw metrics data that needed to be processed and cleaned up for display in Angular. I went online to look how this might be done. And this is how I learned about functional programming. I watched videos from the FunFunFunction youtube channel on functional programming. I remember starting with filter, map and reduce functions.
Learning to use functional programming to process the data was definitely a skill upgrade. And a very enjoyable one. However, having the data shown in the console was one thing. Getting the data from Papaparse to the Angular component was another.
This is were I learned how to use RxJs observables. Wrapping the Papaparse call back result in an observable and subscribing to it was the solution I used.
At this stage, all the client side code was put into one component. This had to be refactored into different components and services.
So I added a service called Metric service. It sends a GET call to a server to fetch the CSV files, then returns an observable for the components to subscribe to.
The navigation bar was separated from the first component and added to a shared folder. I also started to style the application with Bootstrap to add a basic style and responsiveness to the application.
After having the bascic metrics displayed on a component, I decided to implement authentication to the application.
I did some research on how to implement this in a MEAN app. And ended up choosing JWT Token based authentication.
I watched a couple of courses and read a few tutorials on how to get this done.
I implemented the server side with ExpressJs. I used ExpressJs to serve the CSV file, do the server based routing and serve for authentication and authorization API. This will also end up being the server used to serve the Angular client.
On client side I added the routing including the route guards. I then implemented the client side components to signup, signin and register.
Refactoring the UI
Having the data displayed in a table was nice but it did not present perfectly on the big TV screens on the Service Desk floor. So I decided to add a chart and displayed the two main metrics on two separate cards.
I needed the chart to be responsive. I did some research and ended up using Chartist.JS.
I took this as a learning opportunity to improve my CSS knowledge so I can style the Charts accordingly.
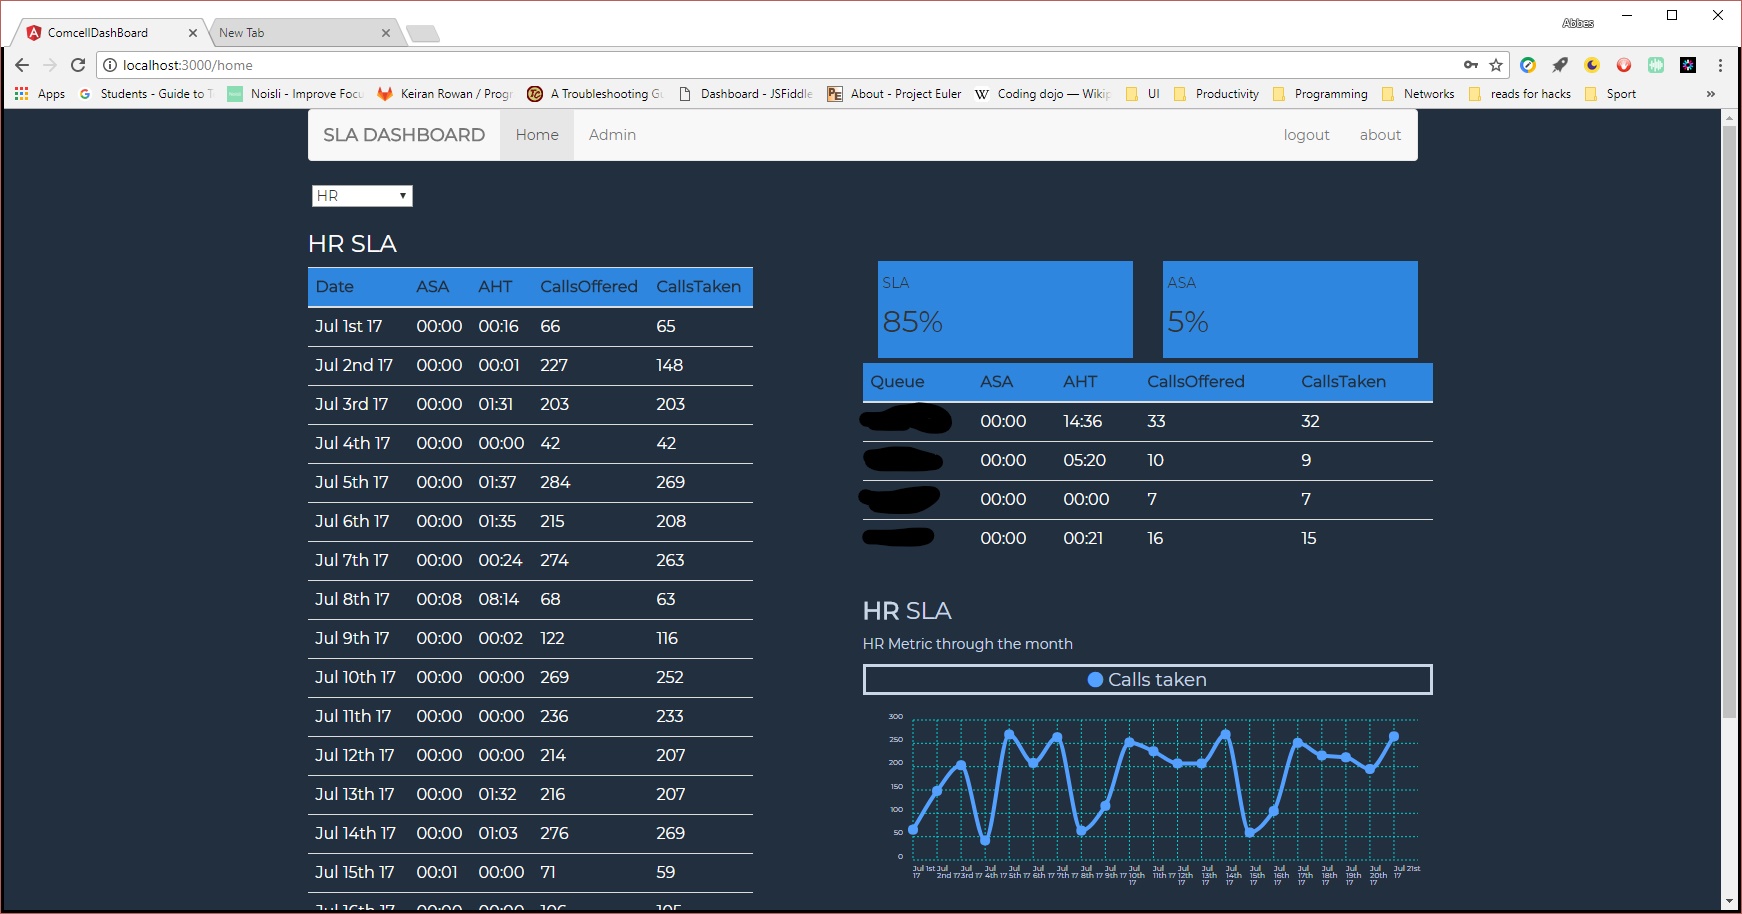
I used a simple combo box to choose from different queues. It a straight forward implementation. Below is a screen shot of the first UI draft.
Deployment
As I had most of the UI ready to be showcased, I needed to deploy the app. I choose to deploy to Azure. The choice was mainly influenced by an Angular course I watched were they used Azure for deployment.
Building the app for deployment to Azure, moving back to a development setup to refactor some code and then rebuild and redeploy without proper build pipeline/workflow was a hassle and a pain. This is were I learned the hard way to have proper environment variables set up for the Angular build as well as the backend node server.
Final Stage
Once done setting up properly Angular and node for Dev and Prod environments, I deployed the app to Azure with a CosmosDb backend. I showed the project to one of my colleagues and got positive feedback as well as some constructive criticism. I worked with the feedback on improving the app. When I look back at the whole experience and how much I've learned I feel really proud of what I managed to achieve.
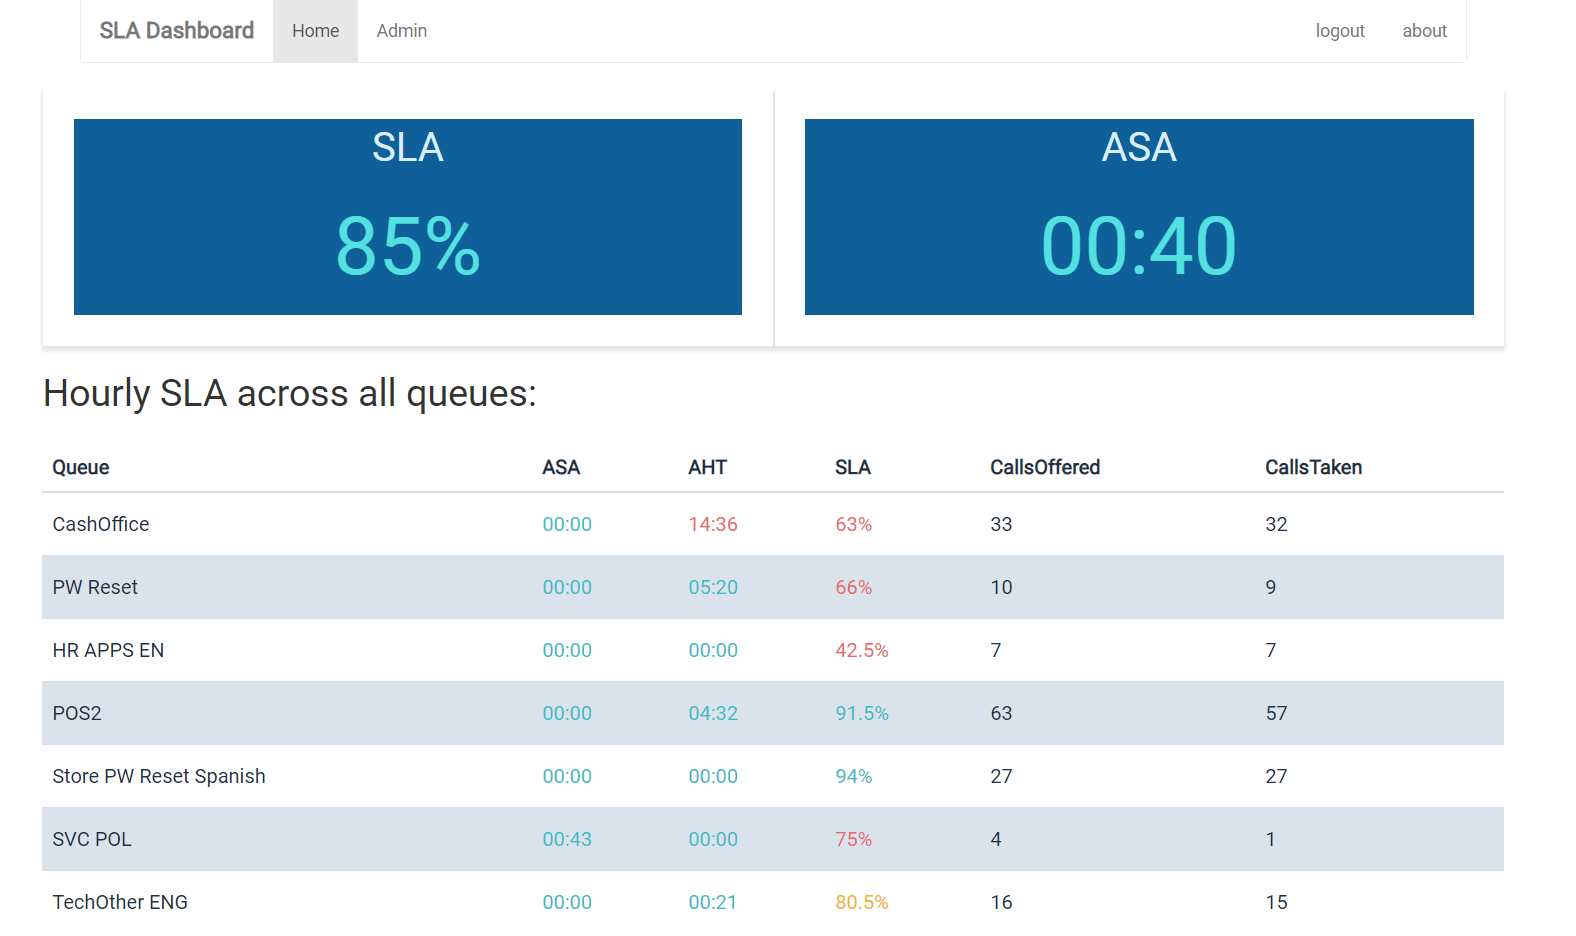
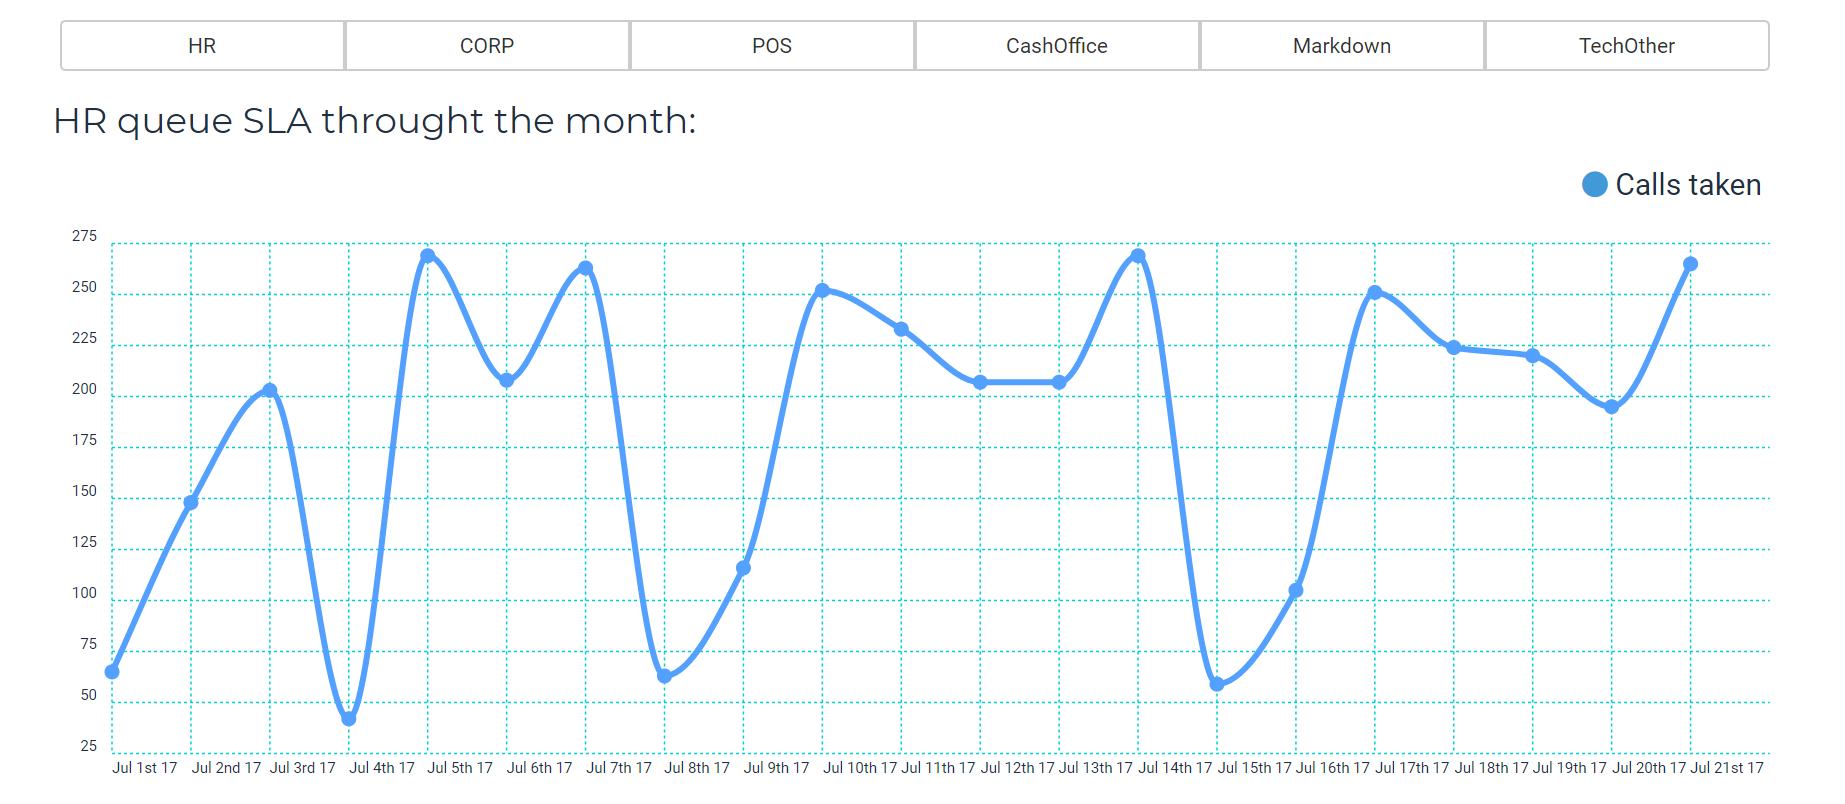
I left the app on the shelf for a bit as I had other projects at hand. In the mean time I improved my knowledge regarding UI and CSS. I decided to use my newly acquired knowledge to refactor the UI one more time. Below is the UI refactored.
Once done with the UI refactoring I wanted to dockerize the app. The first step I took is to review how to set environment variables for both Angular and Node apps so I can go from dev to prod easily. John Papa's article was extremely valuable.
Once the setup was in place I watched Dan Whalin course on Docker for developers. I was then able to dockerize the app. This time I decided to use Heroku as a host and Atlas cloud to host the MongoDB.